Semester Project Computational Movement Analysis
Instructions on working with Quarto and GitHub
These instructions support your semester project in Computational Movement Analysis (Patterns and Trends in Environmental Data).
Prerequisites
To follow these instructions, you need:
- RStudio (or a similar IDE)
- Quarto (see Week 3 - Preparation in Laube and Ratnaweera 2026)
- Git (see Week 3 - Exercise A: Git in Laube and Ratnaweera 2026)
- A GitHub account (see Week 3 - Exercise B: GitHub in Laube and Ratnaweera 2026)
Git and GitHub are required only for submitting your research proposal. When working on your semester project, using Git / GitHub is optional.
Setting up GitHub
Instructions for setting up your repository on GitHub:
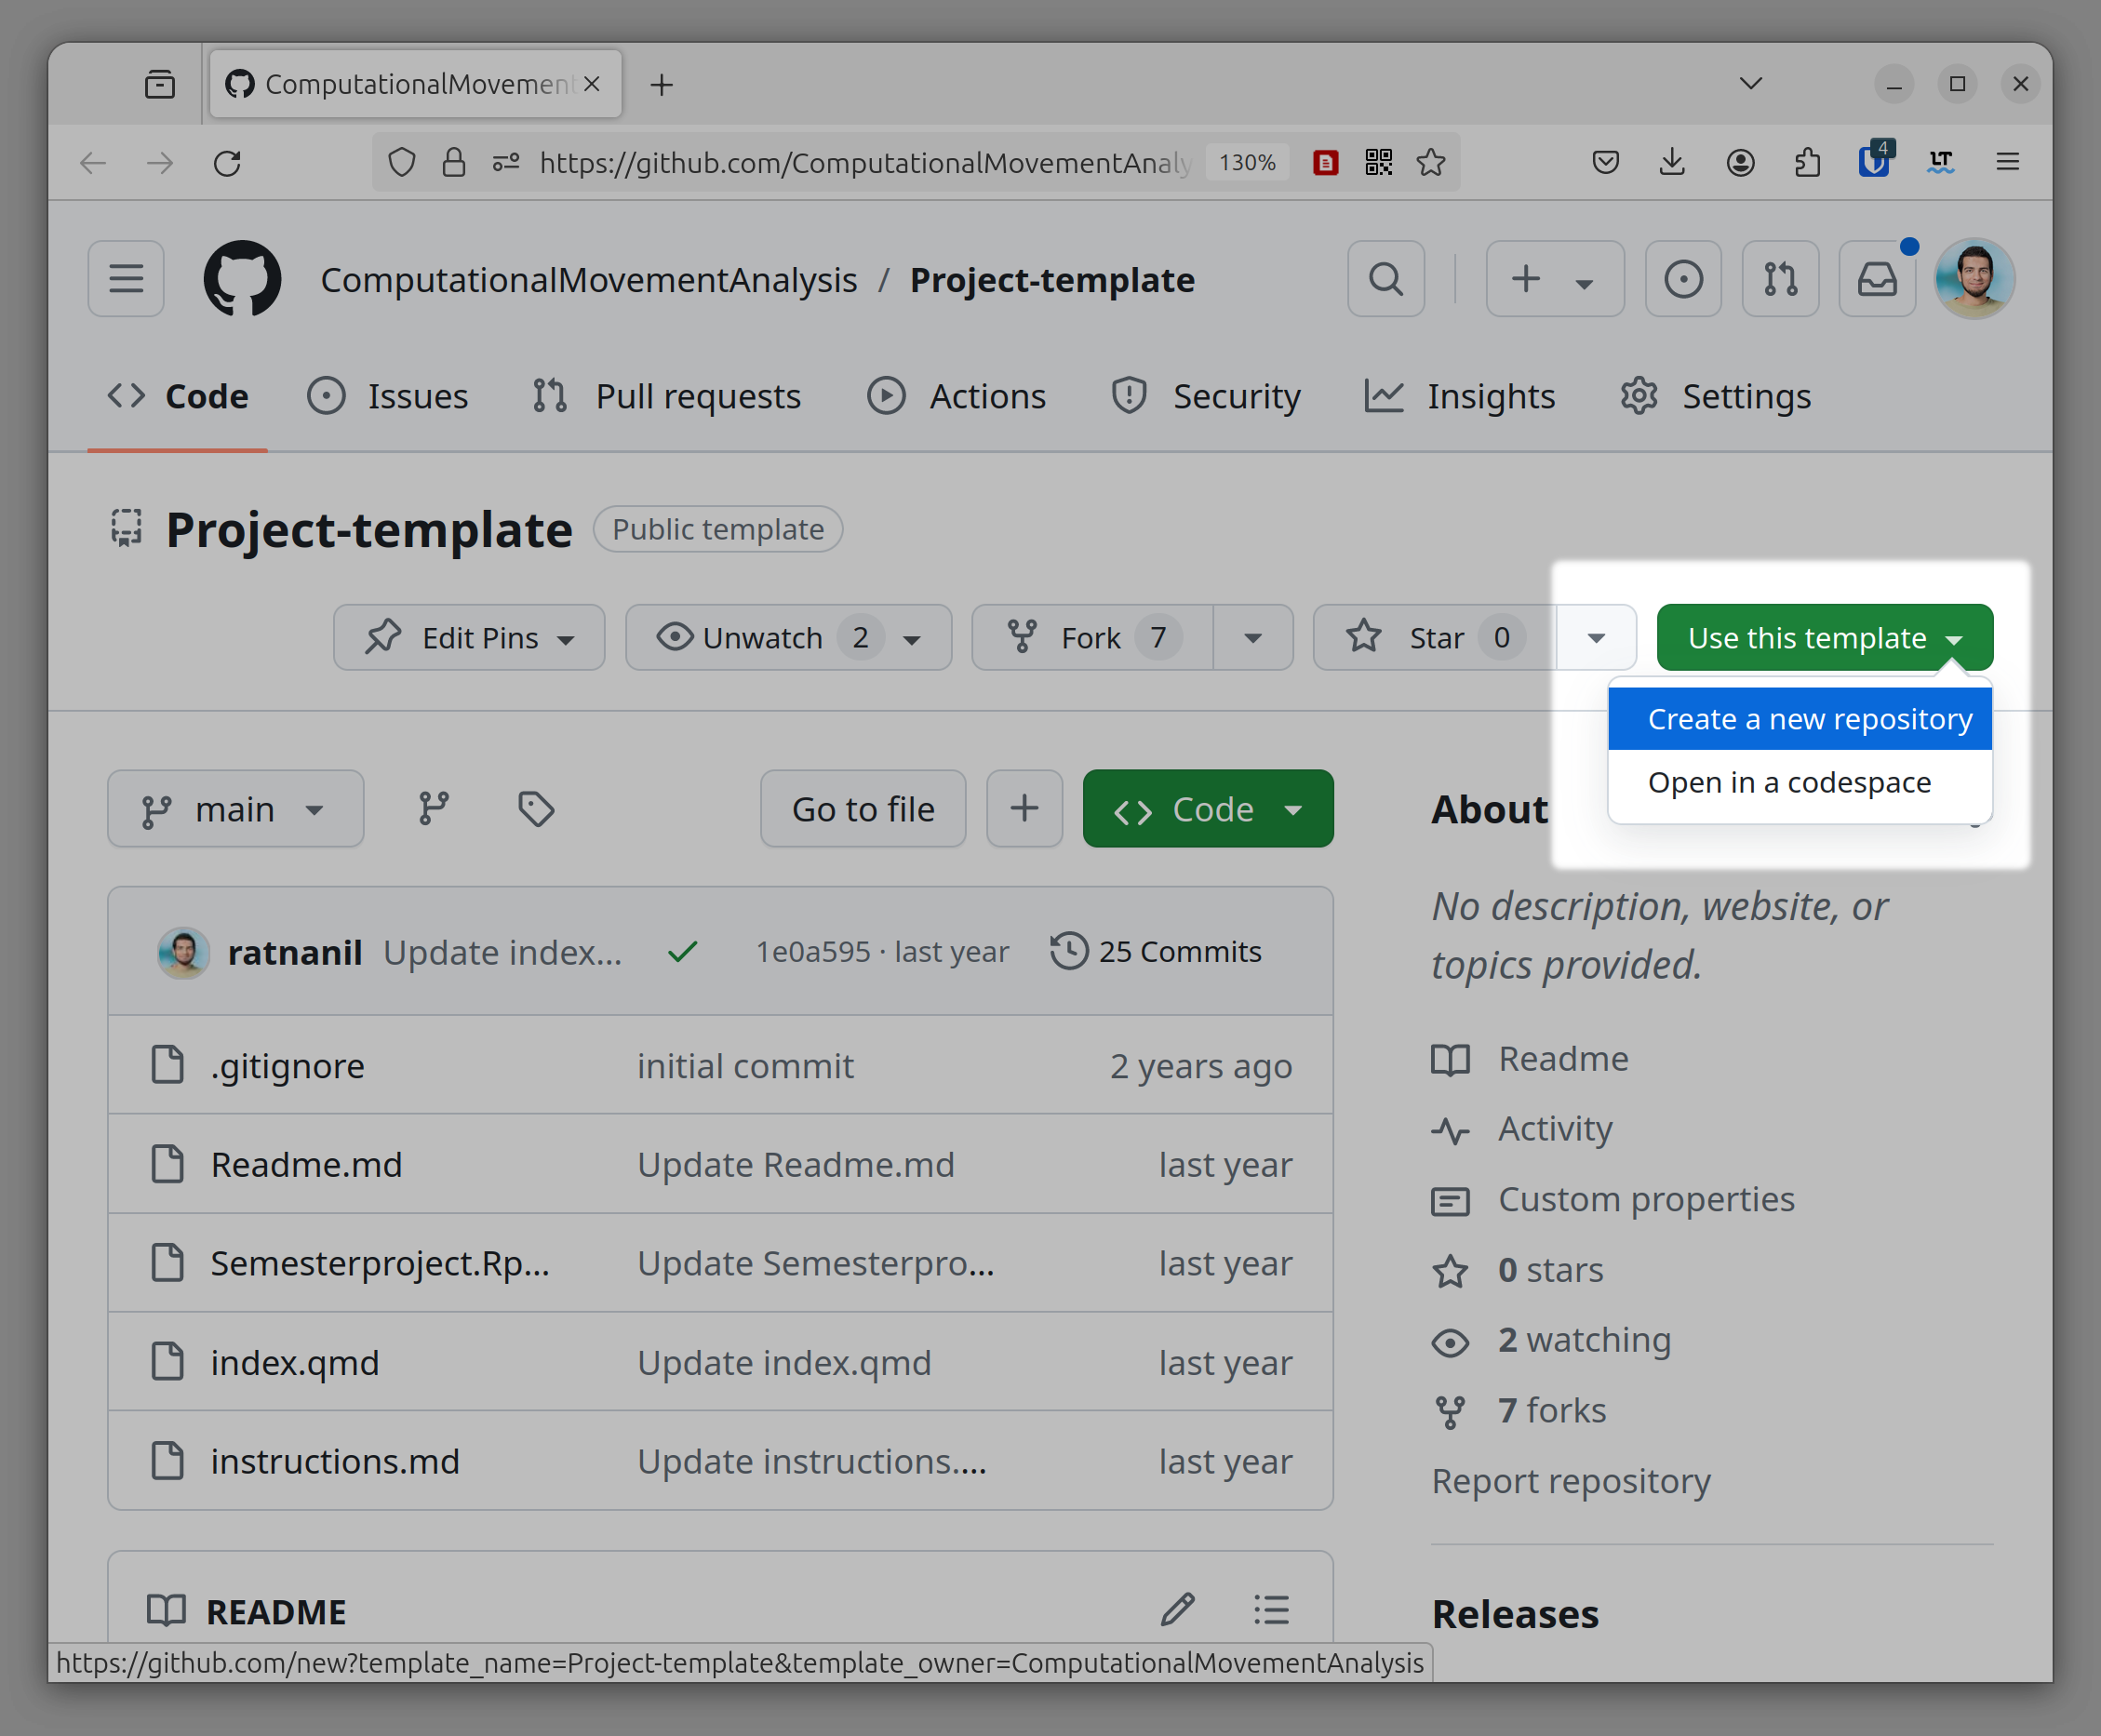
- One team member copies the Template Repo to their GitHub account by clicking on Use this template → Create a new repository (see Figure 1)
- Give the repo a reasonable name and optionally a description, make sure the visibility is set to Public, not Private. Confirm by clicking on Create repository.
- Authenticate your team member on GitHub by clicking on Settings → Collaborators → Add People. Enter the username of your team member and confirm by clicking on the button. Your team member should now accept this invitation which is sent via mail.
Now your repository is correctly set up on GitHub.
Setup your project locally
Now, both team members can setup RStudio to work with the project locally. In RStudio, click on File → New Project → Version Control → Git. In Field Repository URL, copy-and-paste the URL to your GitHub Repo. Choose a reasonable parent directory by clicking on Browse and then click on Create project.
Work on the research proposal in RStudio
The file Readme.md is the file you will use to submit your research proposal. Open this file in RStudio and fill out this markdown document by replacing the placeholders with the information about your project. Once you are done, render the markdown file to pdf by running the following command:
quarto render Readme.md --to pdfNow, add, commit and push your changes to GitHub. You can use the RStudio Git Panel for this or the following bash commands:
git add Readme.md
git add Readme.pdf
git commit -m "add research proposal"
git push
Now, the other team member has to pull the changes that were pushed in the last step. Use the pull button for this or the following git command:
git pullWork on your research project in RStudio
You will use the Quarto-file index.qmd to write your project report. You can develop your R-Code in the first code chunk of this file (the chunk is labelled preprocessing).
Since you will spend most of your time on getting your data into the right form (see Press 2016), the bulk of your R-code will go here. Please add inline comments to this code, and explain what your steps are on a meta level in prose in your document. If you have computationally heavy preprocessing to do, read the section on Heavy Computation.
To write prose (english or german text), use the according Subsections in index.qmd. To add tables, figures or maps to your report, add code chunks in the appropriate section (see Maps, Plots, Tables).
Till now, you have used Git / GitHub to work on your research proposal. To work on your research project, using Git / GitHub is optional. You will need to decide on whether you will use these tools for version control and collaboration with your team mate.
If you decide against using Git / GitHub for collaboration, we recommend you work with a cloud folder with local sync (e.g. SWITCHdrive, Dropbox, or OneDrive). Make sure both team members sync the folder locally so RStudio can access the files directly, and coordinate with your team mate so only one person edits the files at a time to avoid conflicting versions.
Big and/or sensitive Datasets and GitHub
This section only applies if you are using Git and GitHub to manage your project files. If you are not, you can skip it.
Some of the files in the repository should not be tracked via git. This can be due to a big file size or due to the sensitive nature of the data (e.g. your movement data). We recommend that you create a folder called data and move all your datasets into this folder. In order to ignore this folder and files from being tracked by git we need to add it to the .gitignore file. You should already have such a file in your project’s root folder. If this is not the case you can create one by clicking on File → New File → Text File and then saving this file in the root directory of your project with the name .gitignore (note the period!).
Here are some examples on how you can exclude folders and files in .gitignore:
/data             # ignores the folder data
*.csv             # ignores all files that end with .csv
garmin-export.csv # ignores the specific file called garmin-export.csv
For more information on .gitignore have a look here.
If you already have committed a file to Git that you did not want to commit, you can go through these instruction to completely remove it from Git and Github again. If you need help with this, you can get in contact with us.
YAML Header
Note that index.qmd has default chunk options set in the YAML header (first few lines in between the two ---). Please don’t change these specific options (except for the lang option). If for some reason you want to change this behavior for a specific chunk, you can override these options by setting the chunk options within the chunk (more information here).
---
format:
  html:
    code-fold: true     # makes the code in the output collapsable
execute:
  warning: false        # hides warnings from the generated output
  message: false        # hides messages from the generated output
lang: en                # sets the document language to english. Switch to "de" if you write in german
---
Heavy computation
Including all your code index.qmd and rendering it each time you want to preview your report makes your report less error-prone and more reproducible, but this workflow can be cumbersome when the code takes a long time to execute. This prevents you iterating fast when writing up your report. We suggest the following method to solve this:
Outsource your preprocessing steps (and especially the heavy computation) into a separate R-Script called preprocessing.R. Iteratively develop this script to import, clean and prepare your data. Then save your result to a file (e.g. as a geopackage, rda or csv file).
preprocessing.R
#| eval: false
#| echo: false


library(sf)

my_tracks <- read_sf("my_tracking_data.gpx")

# imagine some complex preprocessing logic here:
my_tracks <- filter(my_tracks, segment_id = "one")

# in the end, export your file under a new name:
st_write(my_tracks, "my_tracks.gpkg")
Now, you can import the results from preprocessing.R in index.qmd:
index.qmd
library(sf)

# import the cleaned file from preprocessing.R
my_tracks <- st_read("my_tracks.gpkg")To “prove” that this script runs on your machine from top to bottom, in a new session and without any errors, use the function quarto::render("preprocessing.R"). Do this once you are sure the whole script runs smoothly without any errors.
Publish the resulting file (preprocessing.html) and provide a link in your report (this is a hard requirement).
Maps, Plots, Tables
Interactive maps are only reasonable for small amounts of data (e.g. a few locations of a single wild boar). If you want to show a large amount of data, consider making a static map instead (using tmap_mode("plot")).
If you want to visualize a dataframe as a table, you can use the function knitr::kable(df) (replace df with the name of your data.frame). For more complex tables, consider kableExtra or gt.
To add a caption to a figure, use the #| fig-cap: option, as in the example below. Similarly, a caption for a table is added via #| tbl-cap. More information for figures and tables.
```{r}
#| fig-cap: "A visualisation of the wild boar data"

ggplot(wildboar) +
  geom_sf()
```
To reference a figure in your text, first add a label to the specific chunk using label. You can then reference that figure using the label you specified.
The wildboar move about, see @fig-wildboar.

```{r}
#| fig-cap: "A visualisation of the wild boar data"
#| label: fig-wildboar

ggplot(wildboar) +
  geom_sf()
```
Note that for figures, the label must begin with fig-. For more information, see here.
Similarly, to reference a table in your text, use a label starting with tbl-something and reference it with @tbl-something, as shown below. For more information, read this.
@tbl-wildboar-summary shows a summary of the wildboar data.

```{r}
#| tbl-cap: "A summary of the wildboar data"
#| label: tbl-wildboar-summary

knitr::kable(wildboar_df)
```
Counting Words
To count the number of words in your report, install the R package wordcountaddin.
# install.packages("pacman")
library("pacman")

p_install_gh("benmarwick/wordcountaddin")
Then, add the following code chunk to your report:
wordcountaddin::word_count("index.qmd")Publishing with GitHub
This section only applies if you are using Git and GitHub to manage your project files. If you are not, you can skip it.
To publish your report follow these steps:
- Render your file to html. If your file is called index.qmd this will create a file called index.html
- Push this file (and the corresponding folder
index_files/) to github. Make sure this was successful by looking for these files on GitHub. Alternatively, you can use the methods described here - Activate GitHub Pages on your repo: Settings → Pages → Choose your branch (usually main) → Select Folder “Root”
- Once your page is ready, the url to your website is: username.github.io/reponame/
Citations
To cite a paper:
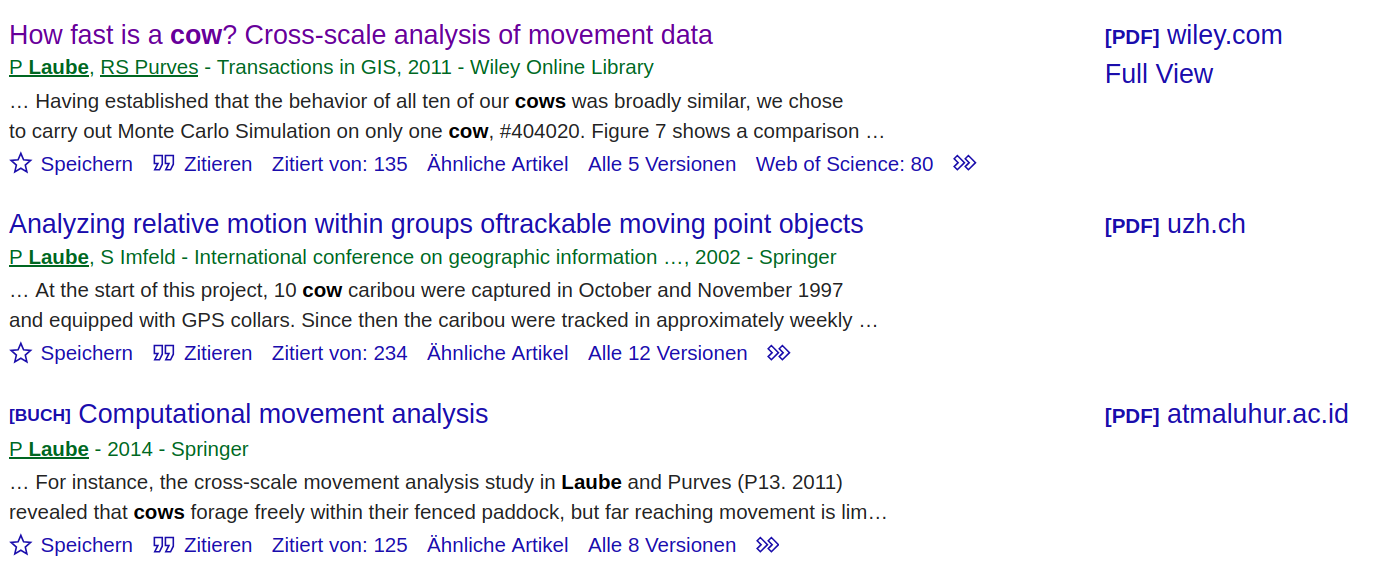
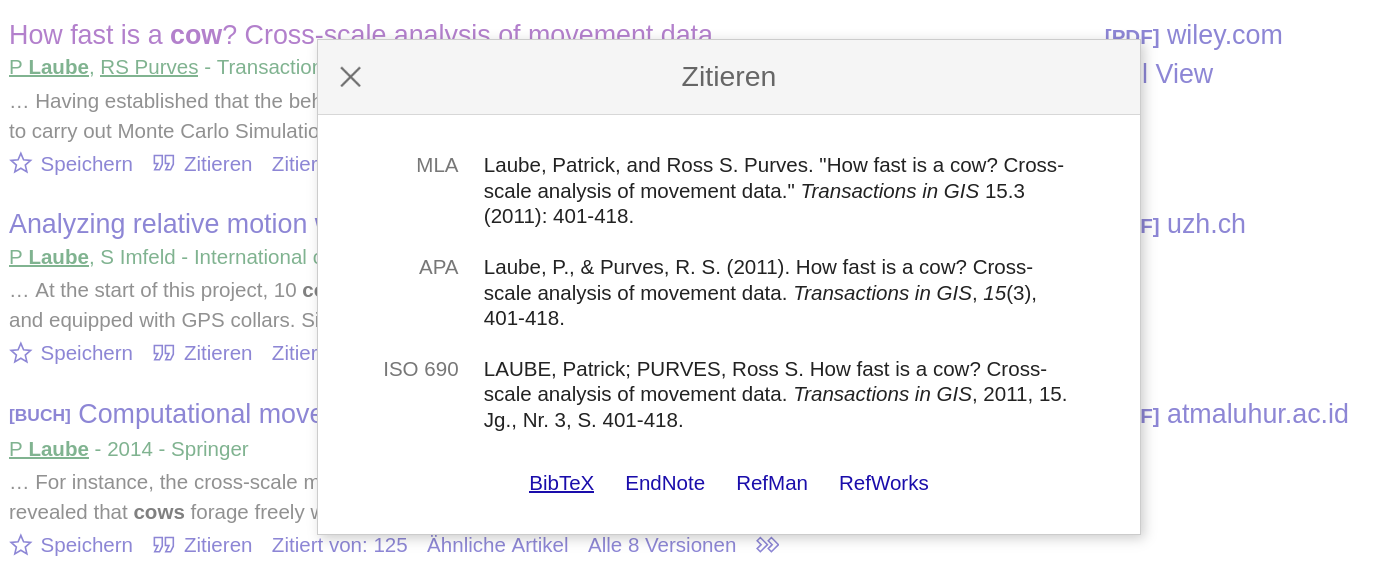
- Export the bibtex key from the paper you want to cite, e.g. using Google Scholar (see Figure 2)
- Copy the bibtex entry to
bibliography.bib(see Listing 1). You can change the entry label if you want (e.g.laube2011). You can add as many bibtex keys to this file as you like - Since
bibliography.bibis the YAML header ofindex.qmdunder the entrybibliography:, you can now cite this paper anywhere in your text using@laube2011. For more citation methods, see https://quarto.org/docs/authoring/citations.html
bibliography.bib
@article{laube2011,
  title={How fast is a cow? Cross-scale analysis of movement data},
  author={Laube, Patrick and Purves, Ross S},
  journal={Transactions in GIS},
  volume={15},
  number={3},
  pages={401--418},
  year={2011},
  publisher={Wiley Online Library}
}
Templates
If you are up for some advanced aspects of writing reports with Quarto, checkout either the Journal Article Template or the ZHAW Thesis Template.